Lived experience
A story from this community is coming soon
This space is reserved for a firsthand account from a young person who experienced the homelessness response system in this community.
About the Author
Placeholder — Awaiting a shared story
YHSI Report 2026
Community Profiles
Pending final review
This work is currently pending final review by our team. This page was last updated on September 14, 2026 at 12:30 PM. This banner will be removed once this page is published.
Ohio
The system is a comprehensive approach to addressing youth homelessness in Ohio. It includes a range of services and programs that are designed to help youth who are experiencing homelessness find stable housing and support.
Ohio CoCs Map
Participating CoCs
OH-506
UrbanOH-507
RuralOH-508
UrbanOH-502
OH-505
UrbanOH-501
UrbanExplore another community
OH-506
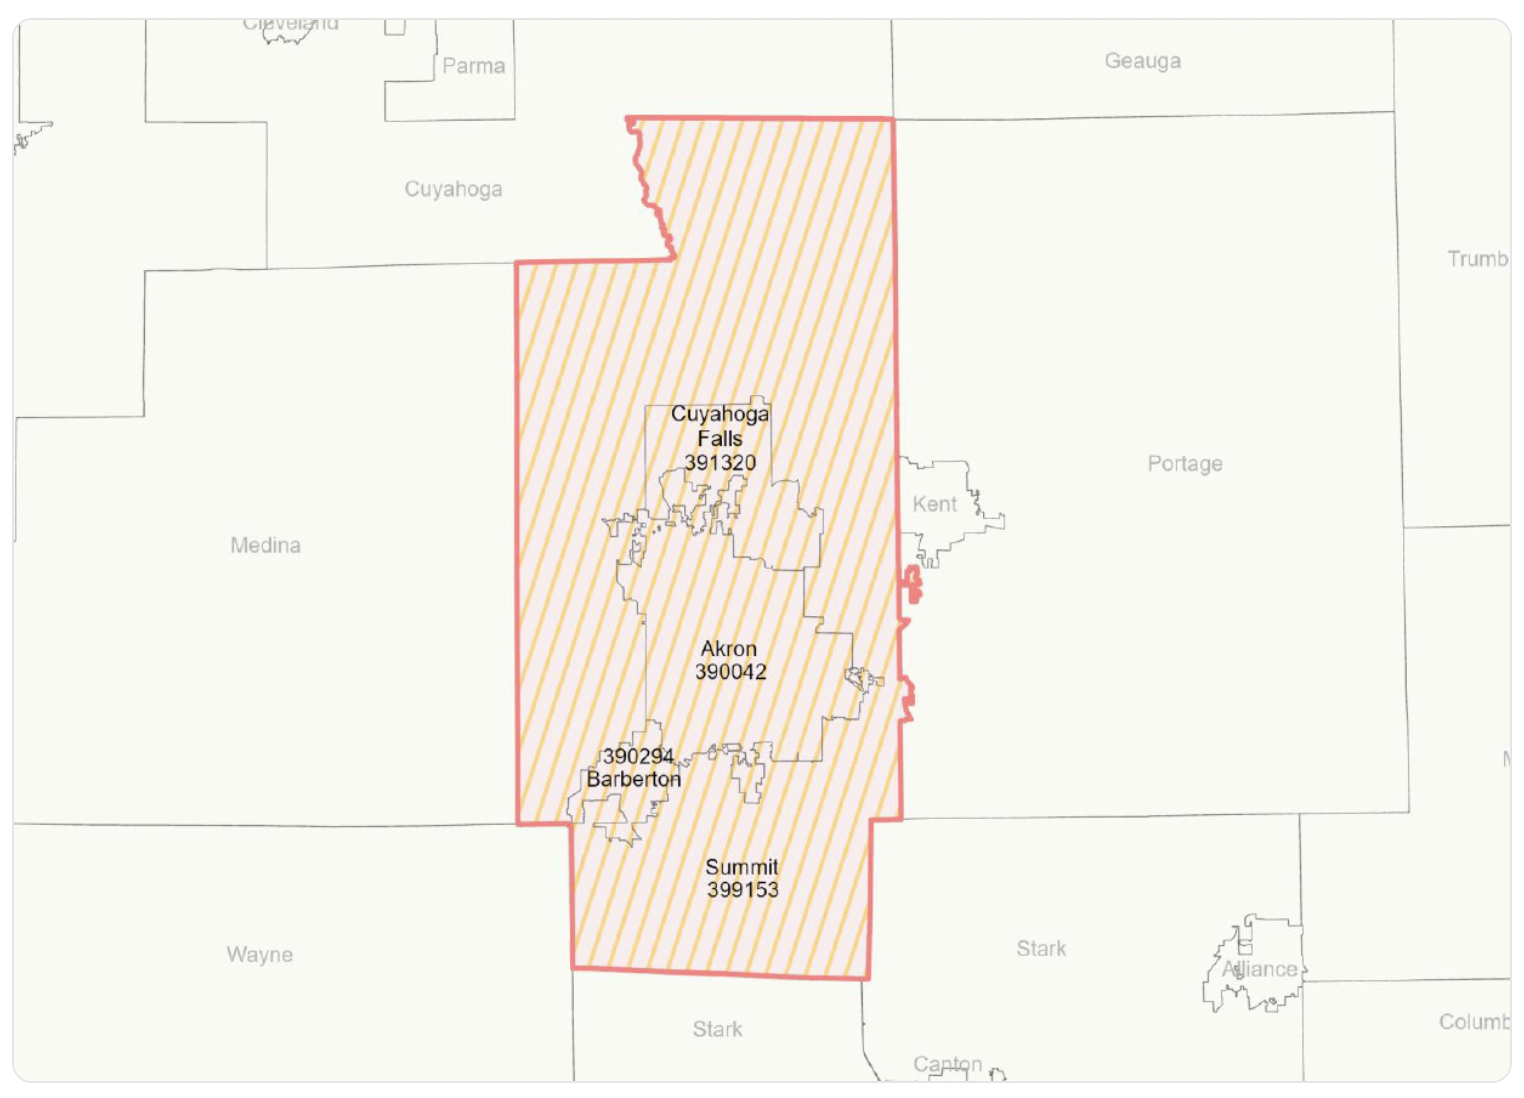
UrbanThe Akron/Barberton CoC (OH-506) coordinates the youth homelessness response for urban Summit County.
413
sq mi area
538K
people in general population
62.8K
people in youth population (15-24)
How youth enter crisis
Placeholder — this section will describe the typical pathways that lead a young person into a housing crisis in this community.
About this section
Lived experience
This space is reserved for a firsthand account from a young person who experienced the homelessness response system in this community.
Placeholder — Awaiting a shared story
| Akron / Summit County
Stella Map FY24HUD’s Stella Performance (Stella P) visualizes how people move through a local homelessness response system, including how long they remain unhoused, where they exit, and whether they return to homelessness. The map below focuses specifically on youth moving through the system, helping highlight pathways, outcomes, and potential system bottlenecks.
| From | To | Households |
|---|---|---|
| Unaccompanied Youth (18-24) | Emergency Shelter | 99 |
| Unaccompanied Youth (18-24) | Rapid Rehousing | 58 |
| Unaccompanied Youth (18-24) | Permanent Supportive Housing | 9 |
| Unaccompanied Youth (18-24) | Transitional Housing | 49 |
| Unaccompanied Youth (18-24) | Other Pathway Combinations | 1 |
| Parenting Youth Households | Emergency Shelter | 27 |
| Parenting Youth Households | Rapid Rehousing | 10 |
| Parenting Youth Households | Permanent Supportive Housing | 2 |
| Parenting Youth Households | Transitional Housing | 1 |
| Child-Only Households | Emergency Shelter | 107 |
| Child-Only Households | Transitional Housing | 10 |
| Emergency Shelter | Exited to Permanent Housing | 84 |
| Emergency Shelter | Exited Non-Permanent/Unknown | 90 |
| Rapid Rehousing | Exited to Permanent Housing | 35 |
| Rapid Rehousing | Exited Non-Permanent/Unknown | 6 |
| Permanent Supportive Housing | Exited to Permanent Housing | 8 |
| Permanent Supportive Housing | Exited Non-Permanent/Unknown | 1 |
| Transitional Housing | Exited to Permanent Housing | 12 |
| Transitional Housing | Exited Non-Permanent/Unknown | 25 |
Very few unaccompanied youth exit shelter directly to a permanent destination — most successful exits happen further downstream.
Average stays run long across both the unaccompanied-youth and child-only populations.
Strong performance — the large majority of enrolled households exit to permanent destinations.
Performs comparably well to rapid re-housing here, though volume is small.
Source: Stella P Youth System Maps, Select Ohio CoCs, FY2024 (Abt Associates), "(OH-506) Akron, Barberton/Summit County CoC" tab, all three population views (AO 18-24 year old / AC Parenting Youth / Child Only) combined into one diagram.
First-stage values are the household (HH) counts shown entering each project type box on the Stella P map (i.e. "served in Homeless System" split by pathway). Second-stage values are derived: "Exited to Permanent Housing" = the numerator of each project type's green "X of Y exiting HH" exit-rate label; "Exited Non-Permanent/Unknown" = Y minus that numerator (households whose enrollment ended during the period without reaching a permanent destination).
NOTE: the exit-rate denominator (Y) is a distinct, Stella-P-defined cohort of households who exited that project type during FY2024 — it is NOT the same as the entry-stage HH count in the first link, so the two stages will not balance numerically; this mirrors how Stella P itself presents the data and is not a data-quality issue.
Pathways/segments with 0 HH are omitted rather than shown as zero-value links. Not yet reviewed/confirmed by Danielle (COHHIO).
| Akron / Summit County
HMIS 2025See which project types served at least one youth-headed household, which were dedicated exclusively to youth, and how many active enrollments they reported.
Youth reach across all projects
87 projects total
Youth-only
Other projects serving youth
No qualifying youth households
Youth-only projects by group
12 projects total
Access, Prevention, and Diversion
Crisis Response and Transitional Housing
Permanent Housing
Of 568 people in a qualifying youth-headed household, how many distinct enrollments did each person contribute during the year?
Access, Prevention, and Diversion project mix
15 projects total
Youth-only
Other projects serving youth
No qualifying youth households
| Entry point | Youth-only | Serving youth | No qualifying | Youth enrollments |
|---|---|---|---|---|
| Coordinated Entry | 0 | 0 | 0 | 0 |
| Street Outreach | 0 | 5 | 0 | 370 |
| Homelessness Prevention | 0 | 6 | 2 | 44 |
| Day Shelter | 0 | 0 | 0 | 0 |
| Services Only | 1 | 0 | 1 | 9 |
| Other | 0 | 0 | 0 | 0 |
| Total | 1 | 11 | 3 | 423 |
Crisis Response and Transitional Housing project mix
21 projects total
Youth-only
Other projects serving youth
No qualifying youth households
| Entry point | Youth-only | Serving youth | No qualifying | Youth enrollments |
|---|---|---|---|---|
| Emergency Shelter – Entry/Exit | 1 | 7 | 0 | 599 |
| Emergency Shelter – Night-by-Night | 0 | 1 | 0 | 60 |
| Safe Haven | 0 | 0 | 2 | 0 |
| Transitional Housing | 4 | 5 | 1 | 70 |
| Total | 5 | 13 | 3 | 729 |
Permanent Housing project mix
51 projects total
Youth-only
Other projects serving youth
No qualifying youth households
| Entry point | Youth-only | Serving youth | No qualifying | Youth enrollments |
|---|---|---|---|---|
| Rapid Re-Housing | 6 | 12 | 8 | 140 |
| Permanent Supportive Housing | 0 | 12 | 13 | 38 |
| Housing Only | 0 | 0 | 0 | 0 |
| Housing with Services | 0 | 0 | 0 | 0 |
| Total | 6 | 24 | 21 | 178 |
Here's how to read this: the project mix bar for each section divides up the total number of projects shown beside it, not the number of enrollments. The figures below the bar (youth-only, other projects which serve youth, and no qualifying youth households) always add up to that total. The table listed below gives the names of these projects. The figure for youth enrollments is a separate one that appears alongside the total, and it shows the recorded activity rather than the number of beds, vacancies, housing placements, or the number of unique young people.
Source: Copy of yhsi_OH-506_20260827_151253.xlsx (OH-506 Project Type Analysis tab).
Figures reflect project-level HMIS activity in 2025, the final year of the configured reporting period, not a running total across the full period.
"Total Projects" counts distinct projects of each HMIS project type with at least one enrollment active at any point during 2025, including project types with zero activity in the final reporting year.
"Served Youth" counts distinct projects of that type that recorded at least one qualifying youth-headed household during 2025. "Youth-Only" counts distinct projects where every household served was a qualifying youth-headed household.
"Active Enrollments" counts distinct EnrollmentID values active during 2025 for people who were part of a qualifying youth-headed household — all active household members are counted, not just the head of household. This is a measure of recorded activity, not beds, vacancies, or housing placements.
Housing & Capacity | Akron / Summit County
HMIS 2025Youth set-aside beds
1,822 beds total
Youth set-aside
Other beds
Youth set-aside beds by pathway stage
63 beds total
Crisis response
Transitional housing
Permanent housing
| Project type | Units | Total beds | Youth set-aside beds |
|---|---|---|---|
| ES Entry/Exit | 211 | 293 | 6 |
| ES Night-by-Night | 162 | 99 | 0 |
| Safe Haven | 21 | 21 | 0 |
| Total | 394 | 413 | 6 |
| Project type | Units | Total beds | Youth set-aside beds |
|---|---|---|---|
| Transitional Housing | 89 | 185 | 18 |
| Total | 89 | 185 | 18 |
| Project type | Units | Total beds | Youth set-aside beds |
|---|---|---|---|
| Permanent Supportive Housing | 651 | 871 | 12 |
| PH Housing Only | 0 | 0 | 0 |
| PH Housing with Services | 0 | 0 | 0 |
| Rapid Re-Housing | 165 | 255 | 27 |
| Total | 816 | 1,126 | 39 |
For each date, inventory is summed across all active inventory records in the project type. Beds count capacity for individual clients; units count capacity for households — equal to beds for projects serving single clients, and less than beds for projects serving families, since a household can occupy more than one bed within a unit. For each reporting year, the value shown is the highest combined daily total reached within that year (Housing Inventory Count method). Bars within a card are scaled to that card's own peak year for the selected metric, so capacity can be compared across years within a project type but not directly across project types. Source: Copy of yhsi_OH-506_20260827_151253.xlsx (OH-506 Beds Inventory / OH-506 Units Inventory tabs).
Youth set-aside bed and unit figures reflect inventory capacity for the year, not real-time vacancy.
The stage-breakdown chart's percentages measure each pathway stage's share of 63 total youth set-aside beds, not of the CoC's overall bed inventory — 63 of 1,822 total beds across every project type in HMIS (3%) are youth set-aside.
The "Beds" column in the tables below shows year-round capacity only for shelter-type project types whose capacity flexes with demand (Emergency Shelter, Safe Haven) — it excludes seasonal and overflow beds, which are additional capacity added in response to demand rather than a fixed baseline. ES Entry/Exit: 35 seasonal/overflow beds not shown in its table row. ES Night-by-Night: 63 seasonal/overflow beds not shown in its table row.
"Youth set-aside beds" counts beds within a project specifically reserved for qualifying youth-headed households, reported separately from the project's total bed count. A "—" instead of a number means this CoC hasn't reported a count for that project type/stage yet, not that the count is confirmed to be zero.
Community Planning & Feedback | Akron / Summit County
YHSI Working GroupsDuring system planning, Akron held a brainstorming session and documented what people said they wanted to see change. This section lists those items, grouped by the type of change requested.
Source: Akron System Map - Program Models Handout; "Key Takeaways: Essential Elements from YHSI Planning & Brainstorming Session(s)."
Explore another community
OH-507
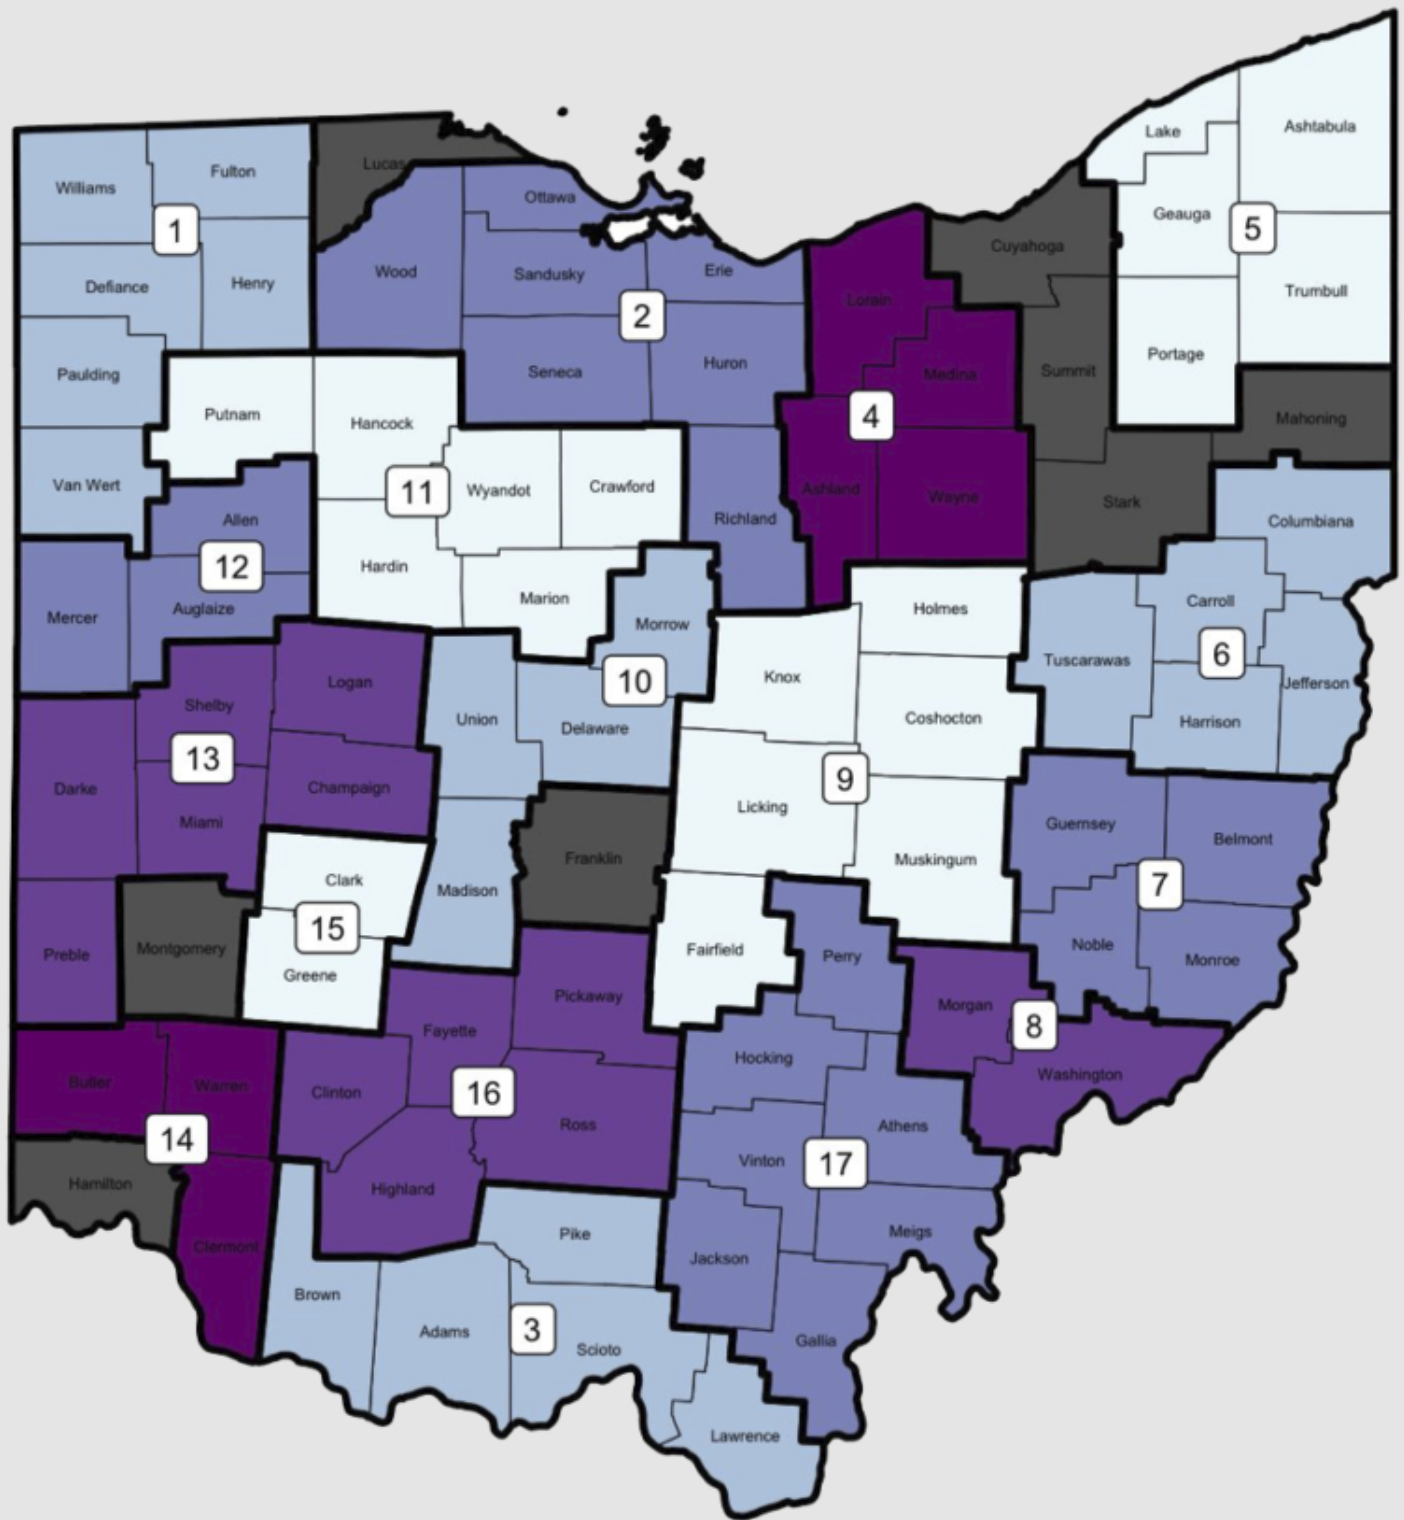
RuralThe Balance of State CoC (OH-507) is Ohio's only rural Continuum of Care, coordinating youth homelessness response across dozens of counties outside the state's major cities.
~37,263
sq mi area
6.3M
people in general population
820K
people in youth population (15-24)
How youth enter crisis
Placeholder — this section will describe the typical pathways that lead a young person into a housing crisis in this community.
About this section
Lived experience
This space is reserved for a firsthand account from a young person who experienced homelessness in this community. We're working with local partners to collect and share these stories with consent, and will replace this placeholder once one is available.
Placeholder — Awaiting a shared story
| Balance of State
Stella Map FY24HUD’s Stella Performance (Stella P) visualizes how people move through a local homelessness response system, including how long they remain unhoused, where they exit, and whether they return to homelessness. The map below focuses specifically on youth moving through the system, helping highlight pathways, outcomes, and potential system bottlenecks.
| From | To | Households |
|---|---|---|
| Unaccompanied Youth (18-24) | Emergency Shelter | 636 |
| Unaccompanied Youth (18-24) | Rapid Rehousing | 236 |
| Unaccompanied Youth (18-24) | Permanent Supportive Housing | 34 |
| Unaccompanied Youth (18-24) | Transitional Housing | 155 |
| Unaccompanied Youth (18-24) | Other Pathway Combinations | 11 |
| Parenting Youth Households | Emergency Shelter | 126 |
| Parenting Youth Households | Rapid Rehousing | 145 |
| Parenting Youth Households | Permanent Supportive Housing | 6 |
| Parenting Youth Households | Transitional Housing | 24 |
| Child-Only Households | Emergency Shelter | 10 |
| Child-Only Households | Transitional Housing | 2 |
| Emergency Shelter | Exited to Permanent Housing | 190 |
| Emergency Shelter | Exited Non-Permanent/Unknown | 356 |
| Rapid Rehousing | Exited to Permanent Housing | 174 |
| Rapid Rehousing | Exited Non-Permanent/Unknown | 56 |
| Permanent Supportive Housing | Exited to Permanent Housing | 19 |
| Permanent Supportive Housing | Exited Non-Permanent/Unknown | 7 |
| Transitional Housing | Exited to Permanent Housing | 42 |
| Transitional Housing | Exited Non-Permanent/Unknown | 42 |
| Other Pathway Combinations | Exited to Permanent Housing | 2 |
| Other Pathway Combinations | Exited Non-Permanent/Unknown | 2 |
Largest system by volume in the study.
Largest transitional housing volume of any CoC, with stays well beyond a typical transitional timeframe.
By far the largest rapid re-housing pipeline in the state — carries the large majority of all rapid re-housing households across the five CoCs studied.
Modest volume relative to rapid re-housing, but exit rates remain strong.
Source: Stella P Youth System Maps, Select Ohio CoCs, FY2024 (Abt Associates), "(OH-507) Ohio Balance of State CoC" tab, all three population views (AO 18-24 year old / AC Parenting Youth / Child Only) combined into one diagram.
First-stage values are the household (HH) counts shown entering each project type box on the Stella P map (i.e. "served in Homeless System" split by pathway). Second-stage values are derived: "Exited to Permanent Housing" = the numerator of each project type's green "X of Y exiting HH" exit-rate label; "Exited Non-Permanent/Unknown" = Y minus that numerator (households whose enrollment ended during the period without reaching a permanent destination).
NOTE: the exit-rate denominator (Y) is a distinct, Stella-P-defined cohort of households who exited that project type during FY2024 — it is NOT the same as the entry-stage HH count in the first link, so the two stages will not balance numerically; this mirrors how Stella P itself presents the data and is not a data-quality issue.
Pathways/segments with 0 HH are omitted rather than shown as zero-value links. Not yet reviewed/confirmed by Danielle (COHHIO).
This CoC's crisis-response volume may be the source of the "900" figure shown elsewhere on the site — confirm it isn't being mischaracterized as an unaccompanied-minors count.
| Balance of State
HMIS 2025See which project types served at least one youth-headed household, which were dedicated exclusively to youth, and how many active enrollments they reported.
Youth reach across all projects
588 projects total
Youth-only
Other projects serving youth
No qualifying youth households
Youth-only projects by group
44 projects total
Access, Prevention, and Diversion
Crisis Response and Transitional Housing
Permanent Housing
Of 3,035 people in a qualifying youth-headed household, how many distinct enrollments did each person contribute during the year?
Access, Prevention, and Diversion project mix
254 projects total
Youth-only
Other projects serving youth
No qualifying youth households
| Entry point | Youth-only | Serving youth | No qualifying | Youth enrollments |
|---|---|---|---|---|
| Coordinated Entry | 7 | 88 | 13 | 2,359 |
| Street Outreach | 6 | 22 | 8 | 298 |
| Homelessness Prevention | 3 | 36 | 34 | 269 |
| Day Shelter | 0 | 0 | 0 | 0 |
| Services Only | 4 | 16 | 13 | 330 |
| Other | 0 | 1 | 3 | 2 |
| Total | 20 | 163 | 71 | 3,258 |
Crisis Response and Transitional Housing project mix
103 projects total
Youth-only
Other projects serving youth
No qualifying youth households
| Entry point | Youth-only | Serving youth | No qualifying | Youth enrollments |
|---|---|---|---|---|
| Emergency Shelter – Entry/Exit | 2 | 63 | 7 | 1,189 |
| Emergency Shelter – Night-by-Night | 0 | 0 | 0 | 0 |
| Safe Haven | 0 | 0 | 0 | 0 |
| Transitional Housing | 10 | 15 | 6 | 273 |
| Total | 12 | 78 | 13 | 1,462 |
Permanent Housing project mix
231 projects total
Youth-only
Other projects serving youth
No qualifying youth households
| Entry point | Youth-only | Serving youth | No qualifying | Youth enrollments |
|---|---|---|---|---|
| Rapid Re-Housing | 11 | 54 | 41 | 841 |
| Permanent Supportive Housing | 1 | 44 | 78 | 158 |
| Housing Only | 0 | 0 | 2 | 0 |
| Housing with Services | 0 | 0 | 0 | 0 |
| Total | 12 | 98 | 121 | 999 |
Here's how to read this: the project mix bar for each section divides up the total number of projects shown beside it, not the number of enrollments. The figures below the bar (youth-only, other projects which serve youth, and no qualifying youth households) always add up to that total. The table listed below gives the names of these projects. The figure for youth enrollments is a separate one that appears alongside the total, and it shows the recorded activity rather than the number of beds, vacancies, housing placements, or the number of unique young people.
Figures reflect project-level HMIS activity in 2025, the final year of the configured reporting period, not a running total across the full period.
"Total Projects" counts distinct projects of each HMIS project type with at least one enrollment active at any point during 2025, including project types with zero activity in the final reporting year.
"Served Youth" counts distinct projects of that type that recorded at least one qualifying youth-headed household during 2025. "Youth-Only" counts distinct projects where every household served was a qualifying youth-headed household.
"Active Enrollments" counts distinct EnrollmentID values active during 2025 for people who were part of a qualifying youth-headed household — all active household members are counted, not just the head of household. This is a measure of recorded activity, not beds, vacancies, or housing placements.
Housing & Capacity | Balance of State
HMIS 2025Youth set-aside beds
10,414 beds total
Youth set-aside
Other beds
Youth set-aside beds by pathway stage
409 beds total
Crisis response
Transitional housing
Permanent housing
| Project type | Units | Total beds | Youth set-aside beds |
|---|---|---|---|
| ES Entry/Exit | 2,462 | 2,925 | 6 |
| ES Night-by-Night | 10 | 0 | 0 |
| Safe Haven | 0 | 0 | 0 |
| Total | 2,472 | 2,925 | 6 |
| Project type | Units | Total beds | Youth set-aside beds |
|---|---|---|---|
| Transitional Housing | 494 | 754 | 106 |
| Total | 494 | 754 | 106 |
| Project type | Units | Total beds | Youth set-aside beds |
|---|---|---|---|
| Permanent Supportive Housing | 3,046 | 4,237 | 9 |
| PH Housing Only | 27 | 27 | 0 |
| PH Housing with Services | 0 | 0 | 0 |
| Rapid Re-Housing | 1,278 | 1,920 | 288 |
| Total | 4,351 | 6,184 | 297 |
For each date, inventory is summed across all active inventory records in the project type. Beds count capacity for individual clients; units count capacity for households — equal to beds for projects serving single clients, and less than beds for projects serving families, since a household can occupy more than one bed within a unit. For each reporting year, the value shown is the highest combined daily total reached within that year (Housing Inventory Count method). Bars within a card are scaled to that card's own peak year for the selected metric, so capacity can be compared across years within a project type but not directly across project types.
Youth set-aside bed and unit figures reflect inventory capacity for the year, not real-time vacancy.
The stage-breakdown chart's percentages measure each pathway stage's share of 409 total youth set-aside beds, not of the CoC's overall bed inventory — 409 of 10,414 total beds across every project type in HMIS (4%) are youth set-aside.
The "Beds" column in the tables below shows year-round capacity only for shelter-type project types whose capacity flexes with demand (Emergency Shelter, Safe Haven) — it excludes seasonal and overflow beds, which are additional capacity added in response to demand rather than a fixed baseline. ES Entry/Exit: 541 seasonal/overflow beds not shown in its table row. ES Night-by-Night: 10 seasonal/overflow beds not shown in its table row.
"Youth set-aside beds" counts beds within a project specifically reserved for qualifying youth-headed households, reported separately from the project's total bed count. A "—" instead of a number means this CoC hasn't reported a count for that project type/stage yet, not that the count is confirmed to be zero.
Community Planning & Feedback | Balance of State
YHSI Working GroupsDuring system planning, Balance of State held a brainstorming session and documented what people said they wanted to see change. This section lists those items, grouped by the type of change requested.
Source: Balance of State System Map - Program Models Handout; "Key Takeaways: Essential Elements from YHSI Planning & Brainstorming Session(s)."
Explore another community
OH-508
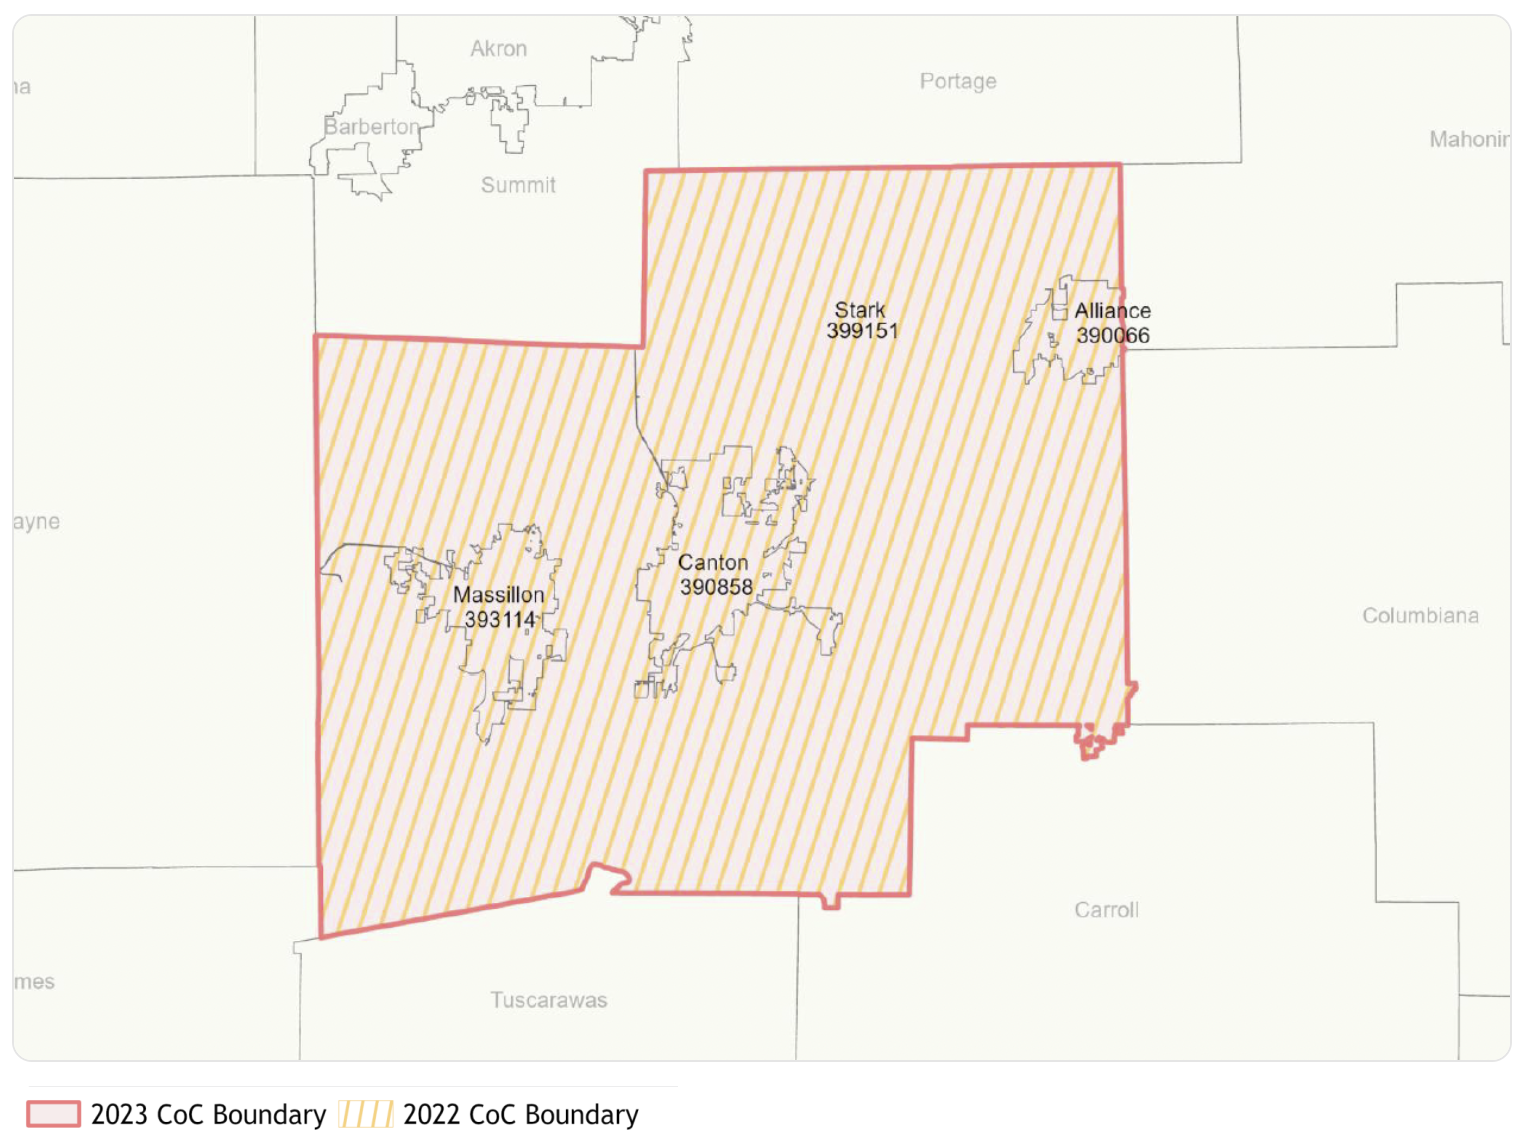
UrbanThe Canton/Massillon/Alliance CoC (OH-508) coordinates the youth homelessness response for urban Stark County.
575
sq mi area
374K
people in general population
45.4K
people in youth population (15-24)
How youth enter crisis
Placeholder — this section will describe the typical pathways that lead a young person into a housing crisis in this community.
About this section
Lived experience
This space is reserved for a firsthand account from a young person who experienced homelessness in this community. We're working with local partners to collect and share these stories with consent, and will replace this placeholder once one is available.
Placeholder — Awaiting a shared story
| Canton / Stark County
Stella Map FY24HUD’s Stella Performance (Stella P) visualizes how people move through a local homelessness response system, including how long they remain unhoused, where they exit, and whether they return to homelessness. The map below focuses specifically on youth moving through the system, helping highlight pathways, outcomes, and potential system bottlenecks.
| From | To | Households |
|---|---|---|
| Unaccompanied Youth (18-24) | Emergency Shelter | 39 |
| Unaccompanied Youth (18-24) | Rapid Rehousing | 9 |
| Unaccompanied Youth (18-24) | Permanent Supportive Housing | 10 |
| Unaccompanied Youth (18-24) | Transitional Housing | 3 |
| Parenting Youth Households | Emergency Shelter | 17 |
| Parenting Youth Households | Rapid Rehousing | 10 |
| Parenting Youth Households | Permanent Supportive Housing | 1 |
| Emergency Shelter | Exited to Permanent Housing | 12 |
| Emergency Shelter | Exited Non-Permanent/Unknown | 30 |
| Rapid Rehousing | Exited to Permanent Housing | 5 |
| Rapid Rehousing | Exited Non-Permanent/Unknown | 8 |
| Permanent Supportive Housing | Exited to Permanent Housing | 6 |
| Permanent Supportive Housing | Exited Non-Permanent/Unknown | 3 |
Smallest system in the study; the Child-Only population shows zero recorded activity across every stage — a genuine coverage gap, not a data error.
Nearly nonexistent — a single-digit household count, entirely within one population.
Sharp disparity: unaccompanied youth exit at a solid rate, while parenting youth show a 0% exit rate despite the longest average housed duration in the entire dataset — a specific equity gap worth naming, not smoothing over.
Same pattern as rapid re-housing — unaccompanied youth exit successfully, parenting youth do not (very small sample, so interpret cautiously).
Source: Stella P Youth System Maps, Select Ohio CoCs, FY2024 (Abt Associates), "(OH-508) Canton, Massillon, Alliance/Stark County CoC" tab, all three population views (AO 18-24 year old / AC Parenting Youth / Child Only) combined into one diagram.
First-stage values are the household (HH) counts shown entering each project type box on the Stella P map (i.e. "served in Homeless System" split by pathway). Second-stage values are derived: "Exited to Permanent Housing" = the numerator of each project type's green "X of Y exiting HH" exit-rate label; "Exited Non-Permanent/Unknown" = Y minus that numerator (households whose enrollment ended during the period without reaching a permanent destination).
NOTE: the exit-rate denominator (Y) is a distinct, Stella-P-defined cohort of households who exited that project type during FY2024 — it is NOT the same as the entry-stage HH count in the first link, so the two stages will not balance numerically; this mirrors how Stella P itself presents the data and is not a data-quality issue.
Pathways/segments with 0 HH are omitted rather than shown as zero-value links. Not yet reviewed/confirmed by Danielle (COHHIO).
| Canton / Stark County
HMIS 2025See which project types served at least one youth-headed household, which were dedicated exclusively to youth, and how many active enrollments they reported.
Youth reach across all projects
71 projects total
Other projects serving youth
No qualifying youth households
Youth-only projects by group
0 projects total
No youth-only projects recorded.
Of 285 people in a qualifying youth-headed household, how many distinct enrollments did each person contribute during the year?
Access, Prevention, and Diversion project mix
19 projects total
Other projects serving youth
No qualifying youth households
| Entry point | Youth-only | Serving youth | No qualifying | Youth enrollments |
|---|---|---|---|---|
| Coordinated Entry | 0 | 0 | 0 | 0 |
| Street Outreach | 0 | 2 | 1 | 6 |
| Homelessness Prevention | 0 | 2 | 5 | 8 |
| Day Shelter | 0 | 0 | 0 | 0 |
| Services Only | 0 | 3 | 6 | 12 |
| Other | 0 | 0 | 0 | 287 |
| Total | 0 | 7 | 12 | 313 |
Crisis Response and Transitional Housing project mix
20 projects total
Other projects serving youth
No qualifying youth households
| Entry point | Youth-only | Serving youth | No qualifying | Youth enrollments |
|---|---|---|---|---|
| Emergency Shelter – Entry/Exit | 0 | 9 | 4 | 92 |
| Emergency Shelter – Night-by-Night | 0 | 0 | 0 | 0 |
| Safe Haven | 0 | 1 | 1 | 1 |
| Transitional Housing | 0 | 1 | 4 | 1 |
| Total | 0 | 11 | 9 | 94 |
Permanent Housing project mix
32 projects total
Other projects serving youth
No qualifying youth households
| Entry point | Youth-only | Serving youth | No qualifying | Youth enrollments |
|---|---|---|---|---|
| Rapid Re-Housing | 0 | 5 | 5 | 24 |
| Permanent Supportive Housing | 0 | 6 | 13 | 27 |
| Housing Only | 0 | 2 | 0 | 4 |
| Housing with Services | 0 | 0 | 1 | 0 |
| Total | 0 | 13 | 19 | 55 |
Here's how to read this: the project mix bar for each section divides up the total number of projects shown beside it, not the number of enrollments. The figures below the bar (youth-only, other projects which serve youth, and no qualifying youth households) always add up to that total. The table listed below gives the names of these projects. The figure for youth enrollments is a separate one that appears alongside the total, and it shows the recorded activity rather than the number of beds, vacancies, housing placements, or the number of unique young people.
Source: Copy of yhsi_OH-508_20260827_150913.xlsx (OH-508 Project Type Analysis tab).
Figures reflect project-level HMIS activity in 2025, the final year of the configured reporting period, not a running total across the full period.
"Total Projects" counts distinct projects of each HMIS project type with at least one enrollment active at any point during 2025, including project types with zero activity in the final reporting year.
"Served Youth" counts distinct projects of that type that recorded at least one qualifying youth-headed household during 2025. "Youth-Only" counts distinct projects where every household served was a qualifying youth-headed household.
"Active Enrollments" counts distinct EnrollmentID values active during 2025 for people who were part of a qualifying youth-headed household — all active household members are counted, not just the head of household. This is a measure of recorded activity, not beds, vacancies, or housing placements.
Housing & Capacity | Canton / Stark County
HMIS 2025Youth set-aside beds
875 beds total
Other beds
Youth set-aside beds by pathway stage
0 beds total
No youth set-aside beds recorded.
| Project type | Units | Total beds | Youth set-aside beds |
|---|---|---|---|
| ES Entry/Exit | 100 | 102 | 0 |
| ES Night-by-Night | 0 | 0 | 0 |
| Safe Haven | 1 | 1 | 0 |
| Total | 101 | 103 | 0 |
| Project type | Units | Total beds | Youth set-aside beds |
|---|---|---|---|
| Transitional Housing | 9 | 9 | 0 |
| Total | 9 | 9 | 0 |
| Project type | Units | Total beds | Youth set-aside beds |
|---|---|---|---|
| Permanent Supportive Housing | 131 | 176 | 0 |
| PH Housing Only | 0 | 0 | 0 |
| PH Housing with Services | 20 | 20 | 0 |
| Rapid Re-Housing | 244 | 546 | 0 |
| Total | 395 | 742 | 0 |
For each date, inventory is summed across all active inventory records in the project type. Beds count capacity for individual clients; units count capacity for households — equal to beds for projects serving single clients, and less than beds for projects serving families, since a household can occupy more than one bed within a unit. For each reporting year, the value shown is the highest combined daily total reached within that year (Housing Inventory Count method). Bars within a card are scaled to that card's own peak year for the selected metric, so capacity can be compared across years within a project type but not directly across project types. Source: Copy of yhsi_OH-508_20260827_150913.xlsx (OH-508 Beds Inventory / OH-508 Units Inventory tabs).
Youth set-aside bed and unit figures reflect inventory capacity for the year, not real-time vacancy.
The stage-breakdown chart's percentages measure each pathway stage's share of 0 total youth set-aside beds, not of the CoC's overall bed inventory — 0 of 875 total beds across every project type in HMIS (0%) are youth set-aside.
The "Beds" column in the tables below shows year-round capacity only for shelter-type project types whose capacity flexes with demand (Emergency Shelter, Safe Haven) — it excludes seasonal and overflow beds, which are additional capacity added in response to demand rather than a fixed baseline. ES Entry/Exit: 21 seasonal/overflow beds not shown in its table row.
"Youth set-aside beds" counts beds within a project specifically reserved for qualifying youth-headed households, reported separately from the project's total bed count. A "—" instead of a number means this CoC hasn't reported a count for that project type/stage yet, not that the count is confirmed to be zero.
Community Planning & Feedback | Canton / Stark County
YHSI Working GroupsDuring system planning, Canton held a brainstorming session and documented what people said they wanted to see change. This section lists those items, grouped by the type of change requested.
Source: Canton System Map - Program Models Handout; "Key Takeaways: Essential Elements from YHSI Planning & Brainstorming Session(s)."
Explore another community
OH-502
UrbanThe Cleveland CoC (OH-502) coordinates the youth homelessness response for urban Cuyahoga County, Ohio's largest single-county system.
TBD
sq mi area
1.25M
people in general population
147.8K
people in youth population (15-24)
How youth enter crisis
Placeholder — this section will describe the typical pathways that lead a young person into a housing crisis in this community.
About this section
Lived experience
This space is reserved for a firsthand account from a young person who experienced homelessness in this community. We're working with local partners to collect and share these stories with consent, and will replace this placeholder once one is available.
Placeholder — Awaiting a shared story
| Cleveland / Cuyahoga County
HMIS 2025See which project types served at least one youth-headed household, which were dedicated exclusively to youth, and how many active enrollments they reported.
Youth reach across all projects
136 projects total
Youth-only
Other projects serving youth
No qualifying youth households
Youth-only projects by group
6 projects total
Access, Prevention, and Diversion
Crisis Response and Transitional Housing
Of 1,695 people in a qualifying youth-headed household, how many distinct enrollments did each person contribute during the year?
Access, Prevention, and Diversion project mix
28 projects total
Youth-only
Other projects serving youth
No qualifying youth households
| Entry point | Youth-only | Serving youth | No qualifying | Youth enrollments |
|---|---|---|---|---|
| Coordinated Entry | 0 | 2 | 0 | 845 |
| Street Outreach | 1 | 1 | 1 | 13 |
| Homelessness Prevention | 0 | 7 | 0 | 191 |
| Day Shelter | 0 | 0 | 0 | 0 |
| Services Only | 2 | 10 | 1 | 663 |
| Other | 0 | 0 | 3 | 0 |
| Total | 3 | 20 | 5 | 1,712 |
Crisis Response and Transitional Housing project mix
35 projects total
Youth-only
Other projects serving youth
No qualifying youth households
| Entry point | Youth-only | Serving youth | No qualifying | Youth enrollments |
|---|---|---|---|---|
| Emergency Shelter – Entry/Exit | 2 | 19 | 4 | 1,216 |
| Emergency Shelter – Night-by-Night | 0 | 0 | 0 | 0 |
| Safe Haven | 0 | 0 | 3 | 0 |
| Transitional Housing | 1 | 3 | 3 | 136 |
| Total | 3 | 22 | 10 | 1,352 |
Permanent Housing project mix
73 projects total
Other projects serving youth
No qualifying youth households
| Entry point | Youth-only | Serving youth | No qualifying | Youth enrollments |
|---|---|---|---|---|
| Rapid Re-Housing | 0 | 14 | 1 | 532 |
| Permanent Supportive Housing | 0 | 33 | 25 | 466 |
| Housing Only | 0 | 0 | 0 | 0 |
| Housing with Services | 0 | 0 | 0 | 0 |
| Total | 0 | 47 | 26 | 998 |
Here's how to read this: the project mix bar for each section divides up the total number of projects shown beside it, not the number of enrollments. The figures below the bar (youth-only, other projects which serve youth, and no qualifying youth households) always add up to that total. The table listed below gives the names of these projects. The figure for youth enrollments is a separate one that appears alongside the total, and it shows the recorded activity rather than the number of beds, vacancies, housing placements, or the number of unique young people.
Source: Copy of yhsi_OH-502_20260827_150723.xlsx (OH-502 Project Type Analysis tab).
Figures reflect project-level HMIS activity in 2025, the final year of the configured reporting period, not a running total across the full period.
"Total Projects" counts distinct projects of each HMIS project type with at least one enrollment active at any point during 2025, including project types with zero activity in the final reporting year.
"Served Youth" counts distinct projects of that type that recorded at least one qualifying youth-headed household during 2025. "Youth-Only" counts distinct projects where every household served was a qualifying youth-headed household.
"Active Enrollments" counts distinct EnrollmentID values active during 2025 for people who were part of a qualifying youth-headed household — all active household members are counted, not just the head of household. This is a measure of recorded activity, not beds, vacancies, or housing placements.
Housing & Capacity | Cleveland / Cuyahoga County
HMIS 2025Youth set-aside beds
11,175 beds total
Youth set-aside
Other beds
Youth set-aside beds by pathway stage
220 beds total
Crisis response
Transitional housing
Permanent housing
| Project type | Units | Total beds | Youth set-aside beds |
|---|---|---|---|
| ES Entry/Exit | 1,375 | 1,581 | 68 |
| ES Night-by-Night | 0 | 0 | 0 |
| Safe Haven | 51 | 51 | 0 |
| Total | 1,426 | 1,632 | 68 |
| Project type | Units | Total beds | Youth set-aside beds |
|---|---|---|---|
| Transitional Housing | 104 | 130 | 48 |
| Total | 104 | 130 | 48 |
| Project type | Units | Total beds | Youth set-aside beds |
|---|---|---|---|
| Permanent Supportive Housing | 5,704 | 7,910 | 46 |
| PH Housing Only | 0 | 0 | 0 |
| PH Housing with Services | 0 | 0 | 0 |
| Rapid Re-Housing | 650 | 1,232 | 58 |
| Total | 6,354 | 9,142 | 104 |
For each date, inventory is summed across all active inventory records in the project type. Beds count capacity for individual clients; units count capacity for households — equal to beds for projects serving single clients, and less than beds for projects serving families, since a household can occupy more than one bed within a unit. For each reporting year, the value shown is the highest combined daily total reached within that year (Housing Inventory Count method). Bars within a card are scaled to that card's own peak year for the selected metric, so capacity can be compared across years within a project type but not directly across project types. Source: Copy of yhsi_OH-502_20260827_150723.xlsx (OH-502 Beds Inventory / OH-502 Units Inventory tabs).
Youth set-aside bed and unit figures reflect inventory capacity for the year, not real-time vacancy.
The stage-breakdown chart's percentages measure each pathway stage's share of 220 total youth set-aside beds, not of the CoC's overall bed inventory — 220 of 11,175 total beds across every project type in HMIS (2%) are youth set-aside.
The "Beds" column in the tables below shows year-round capacity only for shelter-type project types whose capacity flexes with demand (Emergency Shelter, Safe Haven) — it excludes seasonal and overflow beds, which are additional capacity added in response to demand rather than a fixed baseline. ES Entry/Exit: 271 seasonal/overflow beds not shown in its table row.
"Youth set-aside beds" counts beds within a project specifically reserved for qualifying youth-headed households, reported separately from the project's total bed count. A "—" instead of a number means this CoC hasn't reported a count for that project type/stage yet, not that the count is confirmed to be zero.
Explore another community
OH-505
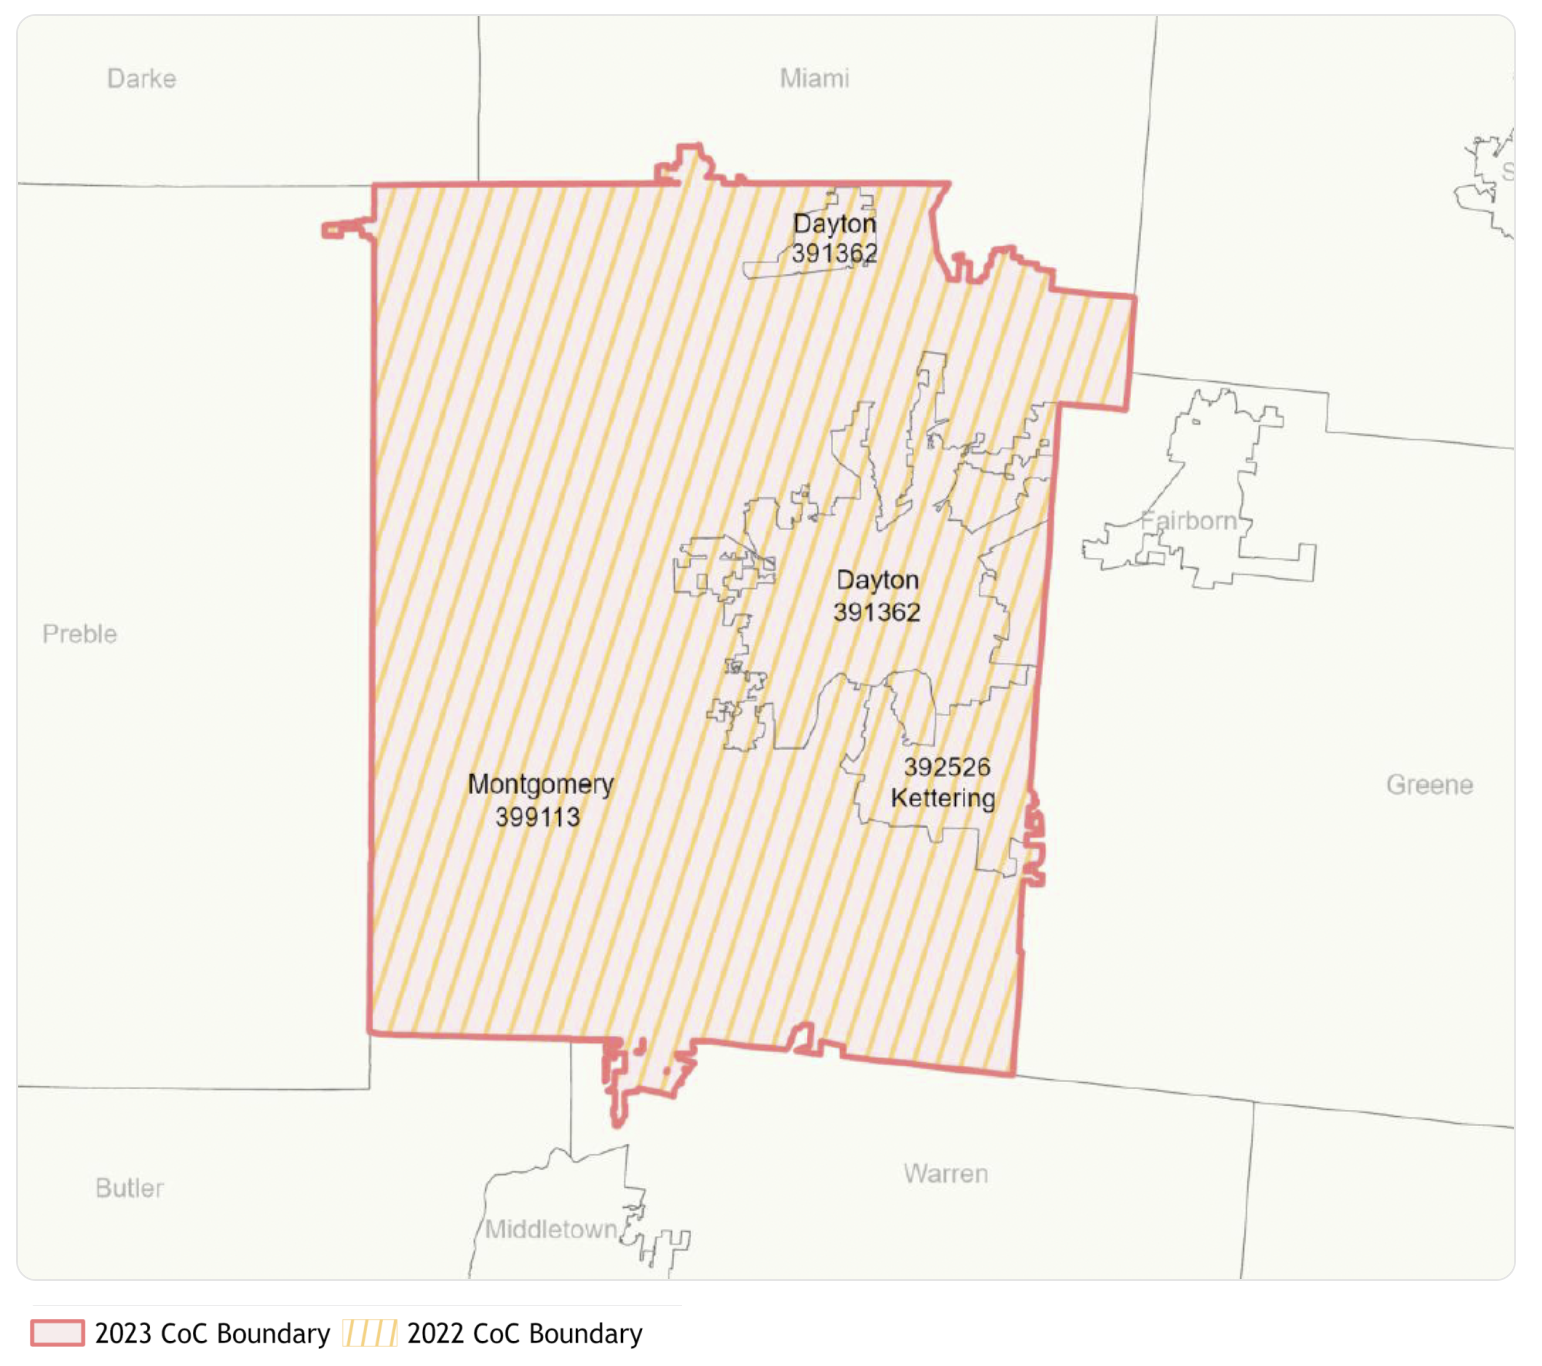
UrbanThe Dayton CoC (OH-505) coordinates the youth homelessness response for Dayton, Kettering, and urban Montgomery County.
461
sq mi area
536K
people in general population
69.4K
people in youth population (15-24)
How youth enter crisis
Placeholder — this section will describe the typical pathways that lead a young person into a housing crisis in this community.
About this section
Lived experience
This space is reserved for a firsthand account from a young person who experienced homelessness in this community. We're working with local partners to collect and share these stories with consent, and will replace this placeholder once one is available.
Placeholder — Awaiting a shared story
| Dayton / Montgomery County
Stella Map FY24HUD’s Stella Performance (Stella P) visualizes how people move through a local homelessness response system, including how long they remain unhoused, where they exit, and whether they return to homelessness. The map below focuses specifically on youth moving through the system, helping highlight pathways, outcomes, and potential system bottlenecks.
| From | To | Households |
|---|---|---|
| Unaccompanied Youth (18-24) | Emergency Shelter | 455 |
| Unaccompanied Youth (18-24) | Rapid Rehousing | 92 |
| Unaccompanied Youth (18-24) | Permanent Supportive Housing | 5 |
| Unaccompanied Youth (18-24) | Transitional Housing | 85 |
| Parenting Youth Households | Emergency Shelter | 52 |
| Parenting Youth Households | Rapid Rehousing | 17 |
| Parenting Youth Households | Permanent Supportive Housing | 3 |
| Parenting Youth Households | Transitional Housing | 8 |
| Parenting Youth Households | Other Pathway Combinations | 3 |
| Child-Only Households | Emergency Shelter | 95 |
| Emergency Shelter | Exited to Permanent Housing | 139 |
| Emergency Shelter | Exited Non-Permanent/Unknown | 243 |
| Rapid Rehousing | Exited to Permanent Housing | 45 |
| Rapid Rehousing | Exited Non-Permanent/Unknown | 3 |
| Permanent Supportive Housing | Exited Non-Permanent/Unknown | 2 |
| Transitional Housing | Exited to Permanent Housing | 18 |
| Transitional Housing | Exited Non-Permanent/Unknown | 16 |
Highest-volume emergency shelter system in the study; child-only households move through fastest, unaccompanied youth stay longest.
Average transitional housing stays run far longer than a typical transitional model — worth naming explicitly rather than averaging away.
Largest and strongest rapid re-housing pipeline in the study — the large majority of enrolled households exit to a permanent destination.
Small permanent supportive housing volume with a 0% exit rate in both cohorts studied — a specific program gap, notably different from rapid re-housing's strong performance in this same CoC.
Source: Stella P Youth System Maps, Select Ohio CoCs, FY2024 (Abt Associates), "(OH-505) Dayton, Kettering/Montgomery County CoC" tab, all three population views (AO 18-24 year old / AC Parenting Youth / Child Only) combined into one diagram.
First-stage values are the household (HH) counts shown entering each project type box on the Stella P map (i.e. "served in Homeless System" split by pathway). Second-stage values are derived: "Exited to Permanent Housing" = the numerator of each project type's green "X of Y exiting HH" exit-rate label; "Exited Non-Permanent/Unknown" = Y minus that numerator (households whose enrollment ended during the period without reaching a permanent destination).
NOTE: the exit-rate denominator (Y) is a distinct, Stella-P-defined cohort of households who exited that project type during FY2024 — it is NOT the same as the entry-stage HH count in the first link, so the two stages will not balance numerically; this mirrors how Stella P itself presents the data and is not a data-quality issue.
Pathways/segments with 0 HH are omitted rather than shown as zero-value links. Not yet reviewed/confirmed by Danielle (COHHIO).
| Dayton / Montgomery County
HMIS 2025See which project types served at least one youth-headed household, which were dedicated exclusively to youth, and how many active enrollments they reported.
Youth reach across all projects
38 projects total
Youth-only
Other projects serving youth
No qualifying youth households
Youth-only projects by group
3 projects total
Crisis Response and Transitional Housing
Permanent Housing
Of 787 people in a qualifying youth-headed household, how many distinct enrollments did each person contribute during the year?
Access, Prevention, and Diversion project mix
5 projects total
Other projects serving youth
No qualifying youth households
| Entry point | Youth-only | Serving youth | No qualifying | Youth enrollments |
|---|---|---|---|---|
| Coordinated Entry | 0 | 0 | 0 | 0 |
| Street Outreach | 0 | 3 | 1 | 261 |
| Homelessness Prevention | 0 | 0 | 0 | 0 |
| Day Shelter | 0 | 0 | 0 | 0 |
| Services Only | 0 | 1 | 0 | 4 |
| Other | 0 | 0 | 0 | 0 |
| Total | 0 | 4 | 1 | 265 |
Crisis Response and Transitional Housing project mix
9 projects total
Youth-only
Other projects serving youth
No qualifying youth households
| Entry point | Youth-only | Serving youth | No qualifying | Youth enrollments |
|---|---|---|---|---|
| Emergency Shelter – Entry/Exit | 0 | 1 | 1 | 247 |
| Emergency Shelter – Night-by-Night | 0 | 4 | 0 | 596 |
| Safe Haven | 0 | 0 | 0 | 0 |
| Transitional Housing | 1 | 2 | 0 | 107 |
| Total | 1 | 7 | 1 | 950 |
Permanent Housing project mix
24 projects total
Youth-only
Other projects serving youth
No qualifying youth households
| Entry point | Youth-only | Serving youth | No qualifying | Youth enrollments |
|---|---|---|---|---|
| Rapid Re-Housing | 2 | 4 | 3 | 120 |
| Permanent Supportive Housing | 0 | 7 | 8 | 31 |
| Housing Only | 0 | 0 | 0 | 0 |
| Housing with Services | 0 | 0 | 0 | 0 |
| Total | 2 | 11 | 11 | 151 |
Here's how to read this: the project mix bar for each section divides up the total number of projects shown beside it, not the number of enrollments. The figures below the bar (youth-only, other projects which serve youth, and no qualifying youth households) always add up to that total. The table listed below gives the names of these projects. The figure for youth enrollments is a separate one that appears alongside the total, and it shows the recorded activity rather than the number of beds, vacancies, housing placements, or the number of unique young people.
Source: Copy of yhsi_OH-505_20260827_151015.xlsx (OH-505 Project Type Analysis tab).
Figures reflect project-level HMIS activity in 2025, the final year of the configured reporting period, not a running total across the full period.
"Total Projects" counts distinct projects of each HMIS project type with at least one enrollment active at any point during 2025, including project types with zero activity in the final reporting year.
"Served Youth" counts distinct projects of that type that recorded at least one qualifying youth-headed household during 2025. "Youth-Only" counts distinct projects where every household served was a qualifying youth-headed household.
"Active Enrollments" counts distinct EnrollmentID values active during 2025 for people who were part of a qualifying youth-headed household — all active household members are counted, not just the head of household. This is a measure of recorded activity, not beds, vacancies, or housing placements.
Housing & Capacity | Dayton / Montgomery County
HMIS 2025Youth set-aside beds
2,936 beds total
Youth set-aside
Other beds
Youth set-aside beds by pathway stage
163 beds total
Crisis response
Transitional housing
Permanent housing
| Project type | Units | Total beds | Youth set-aside beds |
|---|---|---|---|
| ES Entry/Exit | 40 | 40 | 24 |
| ES Night-by-Night | 703 | 569 | 0 |
| Safe Haven | 0 | 0 | 0 |
| Total | 743 | 609 | 24 |
| Project type | Units | Total beds | Youth set-aside beds |
|---|---|---|---|
| Transitional Housing | 84 | 109 | 66 |
| Total | 84 | 109 | 66 |
| Project type | Units | Total beds | Youth set-aside beds |
|---|---|---|---|
| Permanent Supportive Housing | 1,066 | 1,371 | 0 |
| PH Housing Only | 0 | 0 | 0 |
| PH Housing with Services | 0 | 0 | 0 |
| Rapid Re-Housing | 459 | 637 | 73 |
| Total | 1,525 | 2,008 | 73 |
For each date, inventory is summed across all active inventory records in the project type. Beds count capacity for individual clients; units count capacity for households — equal to beds for projects serving single clients, and less than beds for projects serving families, since a household can occupy more than one bed within a unit. For each reporting year, the value shown is the highest combined daily total reached within that year (Housing Inventory Count method). Bars within a card are scaled to that card's own peak year for the selected metric, so capacity can be compared across years within a project type but not directly across project types. Source: Copy of yhsi_OH-505_20260827_151015.xlsx (OH-505 Beds Inventory / OH-505 Units Inventory tabs).
Youth set-aside bed and unit figures reflect inventory capacity for the year, not real-time vacancy.
The stage-breakdown chart's percentages measure each pathway stage's share of 163 total youth set-aside beds, not of the CoC's overall bed inventory — 163 of 2,936 total beds across every project type in HMIS (6%) are youth set-aside.
The "Beds" column in the tables below shows year-round capacity only for shelter-type project types whose capacity flexes with demand (Emergency Shelter, Safe Haven) — it excludes seasonal and overflow beds, which are additional capacity added in response to demand rather than a fixed baseline. ES Night-by-Night: 210 seasonal/overflow beds not shown in its table row.
"Youth set-aside beds" counts beds within a project specifically reserved for qualifying youth-headed households, reported separately from the project's total bed count. A "—" instead of a number means this CoC hasn't reported a count for that project type/stage yet, not that the count is confirmed to be zero.
Community Planning & Feedback | Dayton / Montgomery County
YHSI Working GroupsDuring system planning, Dayton held a brainstorming session and documented what people said they wanted to see change. This section lists those items, grouped by the type of change requested.
Source: Dayton System Map - Program Models Handout; "Key Takeaways: Essential Elements from YHSI Planning & Brainstorming Session(s)."
Explore another community
OH-501
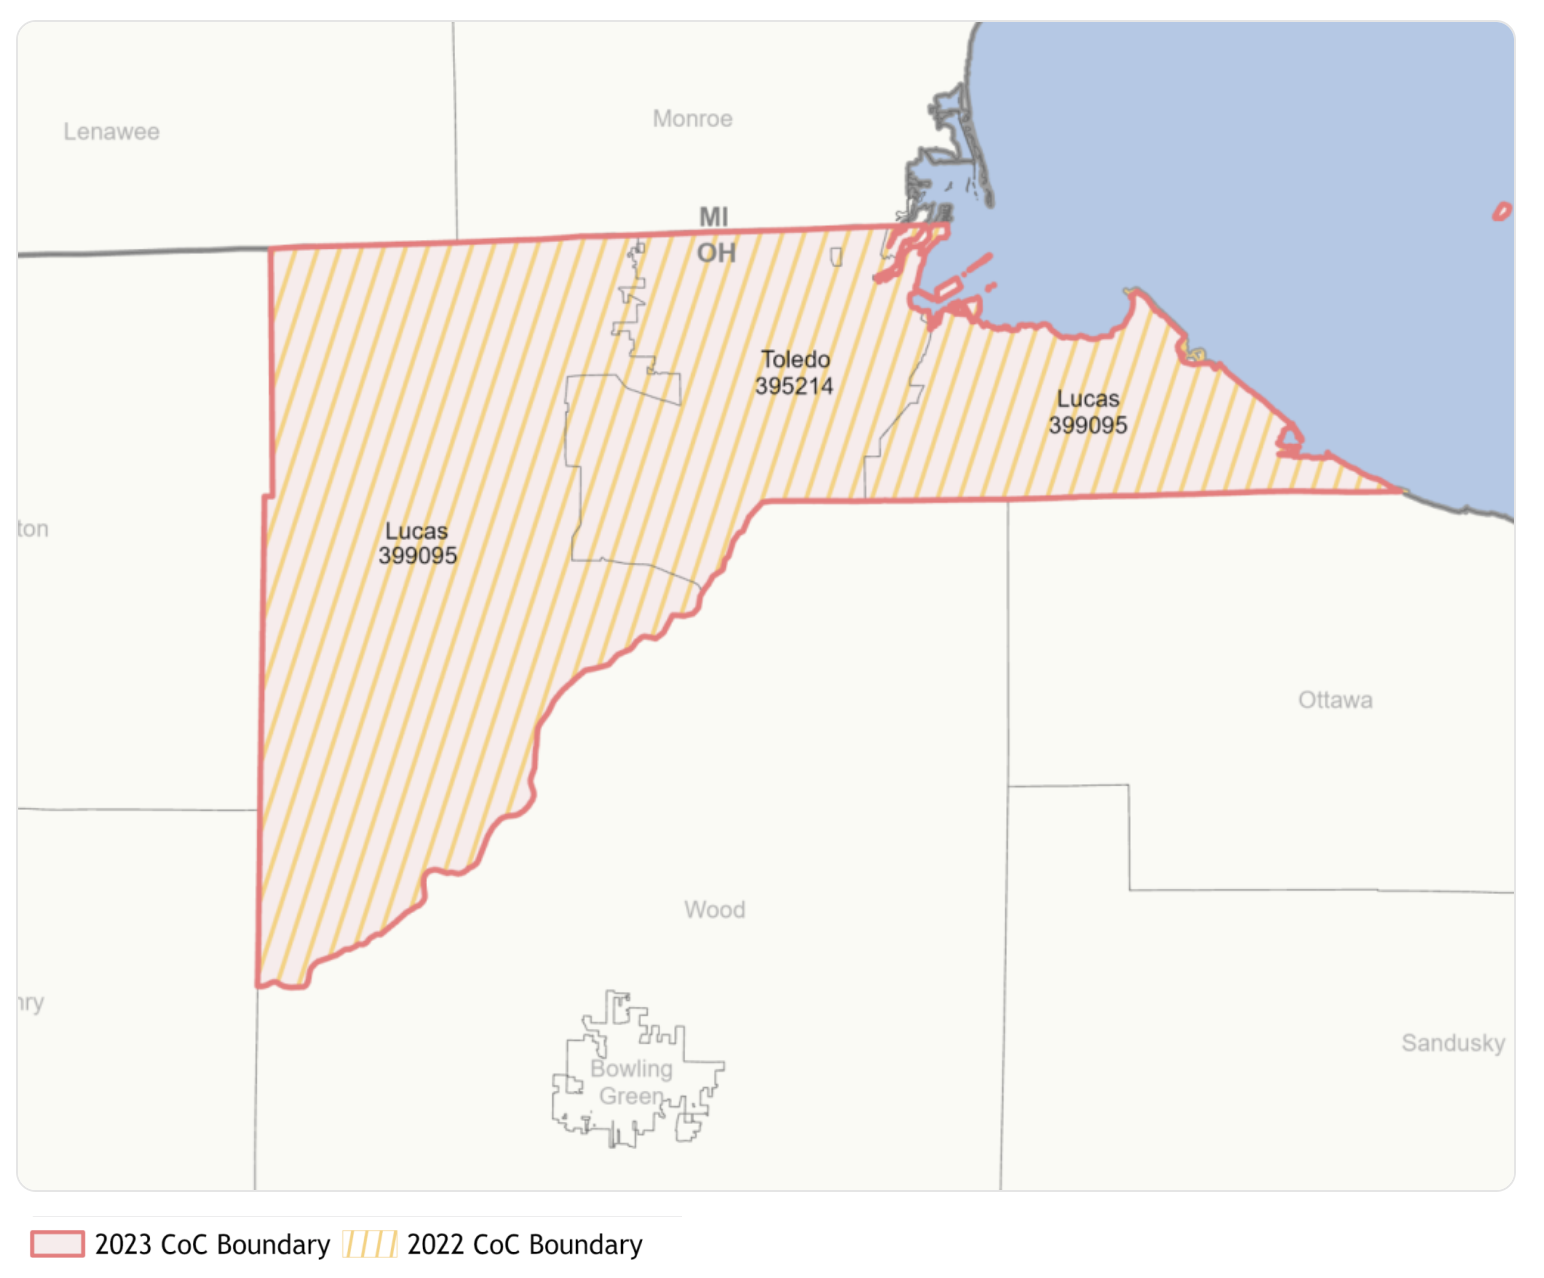
UrbanThe Toledo CoC (OH-501) coordinates the youth homelessness response for urban Lucas County.
340
sq mi area
428K
people in general population
55.0K
people in youth population (15-24)
How youth enter crisis
Placeholder — this section will describe the typical pathways that lead a young person into a housing crisis in this community.
About this section
Lived experience
This space is reserved for a firsthand account from a young person who experienced homelessness in this community. We're working with local partners to collect and share these stories with consent, and will replace this placeholder once one is available.
Placeholder — Awaiting a shared story
| Toledo / Lucas County
Stella Map FY24HUD’s Stella Performance (Stella P) visualizes how people move through a local homelessness response system, including how long they remain unhoused, where they exit, and whether they return to homelessness. The map below focuses specifically on youth moving through the system, helping highlight pathways, outcomes, and potential system bottlenecks.
| From | To | Households |
|---|---|---|
| Unaccompanied Youth (18-24) | Emergency Shelter | 96 |
| Unaccompanied Youth (18-24) | Permanent Supportive Housing | 8 |
| Unaccompanied Youth (18-24) | Transitional Housing | 1 |
| Parenting Youth Households | Emergency Shelter | 9 |
| Parenting Youth Households | Rapid Rehousing | 6 |
| Parenting Youth Households | Permanent Supportive Housing | 4 |
| Parenting Youth Households | Transitional Housing | 1 |
| Child-Only Households | Emergency Shelter | 83 |
| Emergency Shelter | Exited to Permanent Housing | 26 |
| Emergency Shelter | Exited Non-Permanent/Unknown | 140 |
| Rapid Rehousing | Exited to Permanent Housing | 2 |
| Permanent Supportive Housing | Exited to Permanent Housing | 3 |
| Permanent Supportive Housing | Exited Non-Permanent/Unknown | 2 |
| Transitional Housing | Exited to Permanent Housing | 1 |
Length of stay in emergency shelter varies sharply by population — steep drop from unaccompanied youth to child-only households.
Essentially unused pathway — a small handful of households across all three youth populations combined.
Only used for parenting-youth households here — small volume, but a perfect exit rate where it's used.
Modest volume across unaccompanied and parenting youth, with pre-move-in waits ranging widely.
Source: Stella P Youth System Maps, Select Ohio CoCs, FY2024 (Abt Associates), "(OH-501) Toledo/Lucas County CoC" tab, all three population views (AO 18-24 year old / AC Parenting Youth / Child Only) combined into one diagram.
First-stage values are the household (HH) counts shown entering each project type box on the Stella P map (i.e. "served in Homeless System" split by pathway). Second-stage values are derived: "Exited to Permanent Housing" = the numerator of each project type's green "X of Y exiting HH" exit-rate label; "Exited Non-Permanent/Unknown" = Y minus that numerator (households whose enrollment ended during the period without reaching a permanent destination).
NOTE: the exit-rate denominator (Y) is a distinct, Stella-P-defined cohort of households who exited that project type during FY2024 — it is NOT the same as the entry-stage HH count in the first link, so the two stages will not balance numerically; this mirrors how Stella P itself presents the data and is not a data-quality issue.
Pathways/segments with 0 HH are omitted rather than shown as zero-value links. Not yet reviewed/confirmed by Danielle (COHHIO).
| Toledo / Lucas County
HMIS 2025See which project types served at least one youth-headed household, which were dedicated exclusively to youth, and how many active enrollments they reported.
Youth reach across all projects
35 projects total
Other projects serving youth
No qualifying youth households
Youth-only projects by group
0 projects total
No youth-only projects recorded.
Of 756 people in a qualifying youth-headed household, how many distinct enrollments did each person contribute during the year?
Access, Prevention, and Diversion project mix
6 projects total
Other projects serving youth
No qualifying youth households
| Entry point | Youth-only | Serving youth | No qualifying | Youth enrollments |
|---|---|---|---|---|
| Coordinated Entry | 0 | 1 | 1 | 907 |
| Street Outreach | 0 | 1 | 0 | 31 |
| Homelessness Prevention | 0 | 0 | 1 | 0 |
| Day Shelter | 0 | 0 | 0 | 0 |
| Services Only | 0 | 2 | 0 | 106 |
| Other | 0 | 0 | 0 | 0 |
| Total | 0 | 4 | 2 | 1,044 |
Crisis Response and Transitional Housing project mix
11 projects total
Other projects serving youth
No qualifying youth households
| Entry point | Youth-only | Serving youth | No qualifying | Youth enrollments |
|---|---|---|---|---|
| Emergency Shelter – Entry/Exit | 0 | 6 | 0 | 192 |
| Emergency Shelter – Night-by-Night | 0 | 2 | 0 | 140 |
| Safe Haven | 0 | 0 | 1 | 0 |
| Transitional Housing | 0 | 1 | 1 | 5 |
| Total | 0 | 9 | 2 | 337 |
Permanent Housing project mix
18 projects total
Other projects serving youth
No qualifying youth households
| Entry point | Youth-only | Serving youth | No qualifying | Youth enrollments |
|---|---|---|---|---|
| Rapid Re-Housing | 0 | 1 | 1 | 8 |
| Permanent Supportive Housing | 0 | 9 | 7 | 46 |
| Housing Only | 0 | 0 | 0 | 0 |
| Housing with Services | 0 | 0 | 0 | 0 |
| Total | 0 | 10 | 8 | 54 |
Here's how to read this: the project mix bar for each section divides up the total number of projects shown beside it, not the number of enrollments. The figures below the bar (youth-only, other projects which serve youth, and no qualifying youth households) always add up to that total. The table listed below gives the names of these projects. The figure for youth enrollments is a separate one that appears alongside the total, and it shows the recorded activity rather than the number of beds, vacancies, housing placements, or the number of unique young people.
Source: Copy of yhsi_OH-501_20260827_151107.xlsx (OH-501 Project Type Analysis tab).
Figures reflect project-level HMIS activity in 2025, the final year of the configured reporting period, not a running total across the full period.
"Total Projects" counts distinct projects of each HMIS project type with at least one enrollment active at any point during 2025, including project types with zero activity in the final reporting year.
"Served Youth" counts distinct projects of that type that recorded at least one qualifying youth-headed household during 2025. "Youth-Only" counts distinct projects where every household served was a qualifying youth-headed household.
"Active Enrollments" counts distinct EnrollmentID values active during 2025 for people who were part of a qualifying youth-headed household — all active household members are counted, not just the head of household. This is a measure of recorded activity, not beds, vacancies, or housing placements.
Housing & Capacity | Toledo / Lucas County
HMIS 2025Youth set-aside beds
1,803 beds total
Youth set-aside
Other beds
Youth set-aside beds by pathway stage
14 beds total
Crisis response
| Project type | Units | Total beds | Youth set-aside beds |
|---|---|---|---|
| ES Entry/Exit | 41 | 266 | 14 |
| ES Night-by-Night | 26 | 240 | 0 |
| Safe Haven | 0 | 0 | 0 |
| Total | 67 | 506 | 14 |
| Project type | Units | Total beds | Youth set-aside beds |
|---|---|---|---|
| Transitional Housing | 31 | 64 | 0 |
| Total | 31 | 64 | 0 |
| Project type | Units | Total beds | Youth set-aside beds |
|---|---|---|---|
| Permanent Supportive Housing | 614 | 927 | 0 |
| PH Housing Only | 0 | 0 | 0 |
| PH Housing with Services | 0 | 0 | 0 |
| Rapid Re-Housing | 66 | 193 | 0 |
| Total | 680 | 1,120 | 0 |
For each date, inventory is summed across all active inventory records in the project type. Beds count capacity for individual clients; units count capacity for households — equal to beds for projects serving single clients, and less than beds for projects serving families, since a household can occupy more than one bed within a unit. For each reporting year, the value shown is the highest combined daily total reached within that year (Housing Inventory Count method). Bars within a card are scaled to that card's own peak year for the selected metric, so capacity can be compared across years within a project type but not directly across project types. Source: Copy of yhsi_OH-501_20260827_151107.xlsx (OH-501 Beds Inventory / OH-501 Units Inventory tabs).
Youth set-aside bed and unit figures reflect inventory capacity for the year, not real-time vacancy.
The stage-breakdown chart's percentages measure each pathway stage's share of 14 total youth set-aside beds, not of the CoC's overall bed inventory — 14 of 1,803 total beds across every project type in HMIS (1%) are youth set-aside.
The "Beds" column in the tables below shows year-round capacity only for shelter-type project types whose capacity flexes with demand (Emergency Shelter, Safe Haven) — it excludes seasonal and overflow beds, which are additional capacity added in response to demand rather than a fixed baseline. ES Entry/Exit: 85 seasonal/overflow beds not shown in its table row. ES Night-by-Night: 28 seasonal/overflow beds not shown in its table row.
"Youth set-aside beds" counts beds within a project specifically reserved for qualifying youth-headed households, reported separately from the project's total bed count. A "—" instead of a number means this CoC hasn't reported a count for that project type/stage yet, not that the count is confirmed to be zero.
OH-501 Beds Inventory reports 159 beds for PH - Housing Only in 2023, but OH-501 Units Inventory reports 0 units for that same project type and year. Beds without units isn't possible under this metric's own definition (units count capacity for households; beds count capacity for individual clients within those units). Doesn't affect what's currently on screen — the card only shows the latest year (2025), where both are 0 — but the raw 2023 figures are stored as reported. Source: Copy of yhsi_OH-501_20260827_151107.xlsx (OH-501 Beds Inventory / OH-501 Units Inventory tabs). Flagging for confirmation before publication rather than silently reconciling.
Community Planning & Feedback | Toledo / Lucas County
YHSI Working GroupsDuring system planning, Toledo held a brainstorming session and documented what people said they wanted to see change. This section lists those items, grouped by the type of change requested.
Source: Toledo System Map - Program Models Handout; "Key Takeaways: Essential Elements from YHSI Planning & Brainstorming Session(s)."
Toledo's system map also lists "Bridges" under Access, Prevention/Diversion, and Permanent Housing categories without further detail on what "Bridges" is at each stage — same ambiguity flagged for Akron previously.
Explore another community